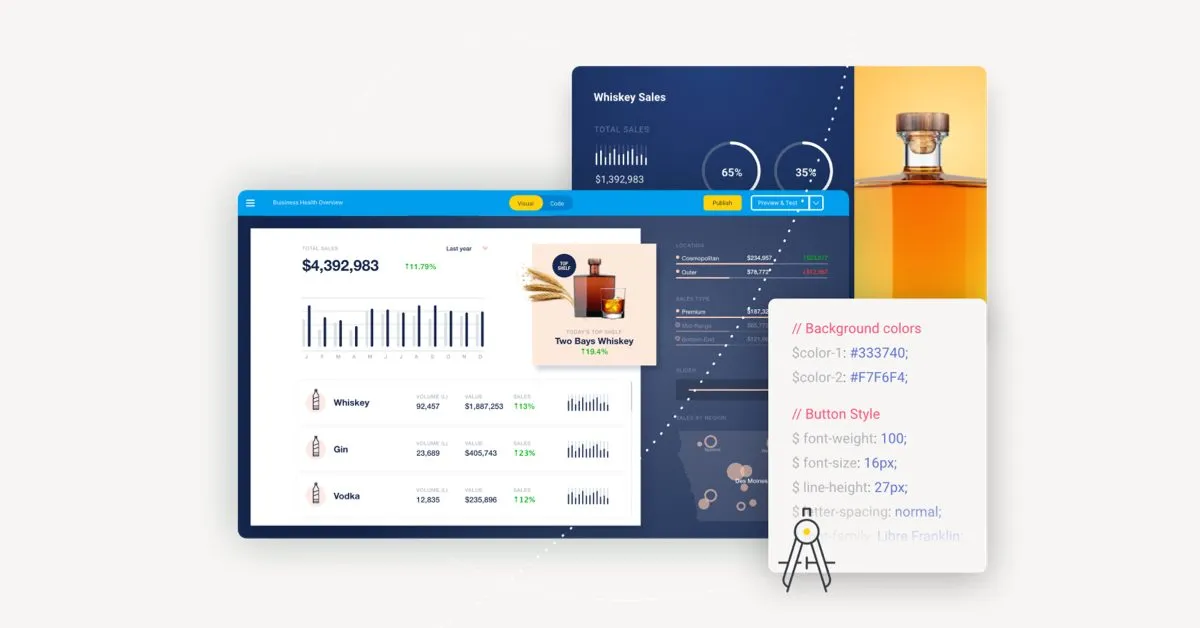
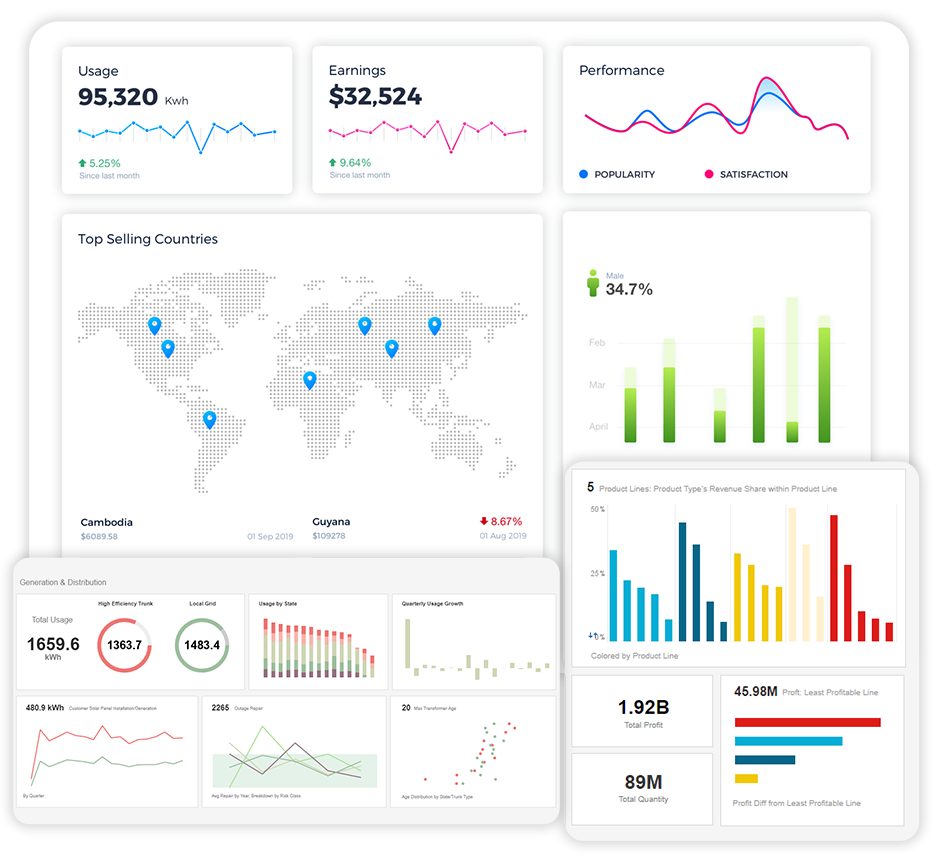
Redefining the way of analyzing data using Smart IG solutions
Transform your raw data into a stunning dashboard that delivers outstanding insights.
Uncover Hidden Insights !
Insights Consultancy Services’ Smart InteGraphics helps businesses to easily turn raw data into actionable insights which allows businesses to connect, prepare, and analyze their data, create stunning data visualizations, and discover hidden insights, all within minutes.
Whether you looking to:
- Create visually appealing and interactive reports and dashboards.
- Get the ability to integrate data from multiple sources to get a holistic view of entire operations.
- Get real-time data.
- Make non-technical users’ lives easy when it comes to making decisions with highly complex data .
- Make data-driven predictions or forecast trends.
We, at ICS, are here to provide you with cutting-edge solutions that simplify data management and empower your decision-making process through compelling visuals. Let us transform your data into actionable insights with ease and precision.

Elements of SmartIG
Data Migration & Integration
Unify and streamline your enterprise data by seamlessly migrating and integrating data from disparate sources and formats. This comprehensive solution ensures smooth data sharing, better connectivity, and efficient processing.
Database connections (Oracle, MYSQL, MSSQL, MS Access, SQLite, PostgreSQL)
Allowed file formats (CSV, XLS. XLSX, XML, TEXT, JSON)
ERP connectivity (SAP and ORACLE)
Online Services (Facebook, Twitter, LinkedIn)
API Integration
Cloud Integration
Data warehousing
E-commerce Integration
Enterprise Application Integration
01
Data Analytics
Transform raw data into stunning visuals. Leverage cutting-edge technologies and tools to analyze intricate datasets; uncover patterns, trends, and opportunities; and empower businesses with actionable insights and data-driven decision-making.
Prescriptive & predictive analytics
Real-time dashboards and charts
Tracking trends and metrics
Business performance insights
Drill-down capabilities
CXO Dashboards [Spend, Performance, ROI, KPIs, SLAs
On-demand real-time Infographics & Cockpit Views
AI-driven insights
Co-pilot, a conversational AI
02
Top Data Analytics Challenges Solved With SmartIG


Everything you need to provide seamless customer service

Interactive Dashboard
No coding skills or other technical expertise is required!. All you need to do is just drag and drop your required items. Infographics will be auto-generated.

Access Various Controls
Seamless customization and real-time insights are at your fingertips through dashboard-level controls, card-level controls, and chart-level controls. Dive deeper into your metrics with precision and empower your data-driven decisions like never before!.

Uncover insights with AI
Make the best use of our analytical tool powered by AI that unveils in-depth insights even at a granular level. Uncover trends, patterns, and correlations. Moreover, the AI forecast feature lets you predict future outcomes.

Predictive & Prescriptive Analytics
Gain insights from historical data, forecast future results, and work on valuable recommendations. Different filters are available for providing deep insights that segment data by customers, product categories, geographical regions, and specific time intervals.

Co-pilot: Your virtual assistant
Co-pilot, powered by AI and ML algorithms is designed to suggest analyses, anticipate requirements, and help you make strategic decision-making. It is multi-lingual, trained contextually, and acts as a Subject Matter Expert.

Drill-down Capabilities
From high-level to granular-level analytics, we’ve got you covered!. The level of detail is crucial to fine-tuning business processes, operational optimization, and targeted marketing strategies. Gain detailed insights into individual data points, transactions, or customer behaviours.

Advanced chart gallery
Get in-depth insights into your business by availing 25+ chart types and their features. Switch between various chart types in real-time. Customize the look of the entire dashboard through a colour palette.

Infuse analytics with visualization
Simplify organizational complex data and tell your data story with compelling visuals through on-demand real-time Infographics and cockpit views. Use canned and user-configured reports to speed up your decision-making through these evidence-based insights.
With Insights Consulting Services Smart Integraphics Results You Can Expect
01
Boost Data Accuracy By Reducing Errors 20% To 30%
02
Expect a 25% to 40% Improvement In Data Integration.
03
20% to 30% Faster Decision-Making.
04
15% to 25% Reduction In Data Management Costs
05
20% to 40% Deeper Understanding Of Your Target Audience
